Versatile Uses of Leaf Spectral Information

Scott Trimble
October 14, 2020 at 3:28 am | Updated March 15, 2022 at 12:17 pm | 10 min read
Leaf spectral signatures are non-destructive and are collected with handheld instruments onsite or with remotely sensed imagery. They have applications that range from basic and applied research to the day-to-day management of farms. Leaf spectral information is used to inform decisions for better control over operations to optimize food, fiber, and timber production. Leaf spectral data is also a standard indicator in a scientist’s toolbox to study plants’ health, growth, and even get information on their environment.
Interaction of Light Spectra and Leaves
Leaf spectral information is derived from spectroscopy, or interaction of light, with the biochemical, physical, and physiological features of a leaf. This can be a measurement of the amount of light absorbed, reflected, or transmitted by compounds.
The following features influence leaf spectra and can, therefore, be used in analytics:
Subscribe to the CID Bio-Science Weekly article series.
By submitting this form, you are consenting to receive marketing emails from: . You can revoke your consent to receive emails at any time by using the SafeUnsubscribe® link, found at the bottom of every email. Emails are serviced by Constant Contact
- Leaf anatomical features such as thickness, mesophyll structure, cuticle structure, and epicuticular wax.
- Biochemistry such as presence and concentrations of pigments, dry matter, and minerals.
- Leaf physiology like moisture content, photosynthetic efficiency, and chlorophyll fluorescence.
The light bands used to measure leaf spectra can be in the visible (VIS, 400–700 nm), near-infrared (NIR, 700–1100 nm), and shortwave infrared (SWIR, 1100–2500 nm) range of wavelengths. For example,
- Plant pigments such as chlorophyll and carotenoids react to visible light,
- water content is sensitive to VIS–NIR–SWIR,
- and dry matter, proteins, carbohydrates, and sugars react to NIR and SWIR.
Leaf spectral data collection is standard in various spheres of plant monitoring and control, as it can be collected rapidly, on a small leaf-scale, and through large-scale remote sensing.
Advanced remote sensing options combined with robotics and data analysis have mainstreamed the use of leaf spectral data in precision, smart farming, and forestry by using large-scale imagery.
Leaf-scale measurements are possible with handheld portable tools manufactured by CID Bio-Science Inc.:
- The CI-710 SpectraVue Leaf Spectrometer that measures light transmittance, absorbance, and reflectance of leaves,and estimates several vegetative indices.
- The CI-340 Handheld Photosynthesis System that measures chlorophyll fluorescence.
Leaf spectra can help farmers and foresters by giving them precise and rapid answers to many of the problems they face.
Application of Leaf Spectral Data in Agriculture
Leaf spectral information can help farmers who need to take effective measures to optimize field conditions for the ideal growth and health of their crops, orchards, or vineyards. The technique helps them by answering questions they face in their day-to-day farm operations, such as the following:
- What is the rate of seed germination and crop emergence? Is replanting necessary to get the optimum crop population?
- Is the crop growth adequate? Is it necessary to add fertilizer? Where and how much fertilizer to add?
- Is the crop suffering from stress? What kind of stress is affecting the farm? What is the intensity of stress, and which parts of the fields are affected by weeds, pests, or diseases? How much treatment needs to be applied
- Where, when, and how much to irrigate in case of drought?
1. Crop Emergence
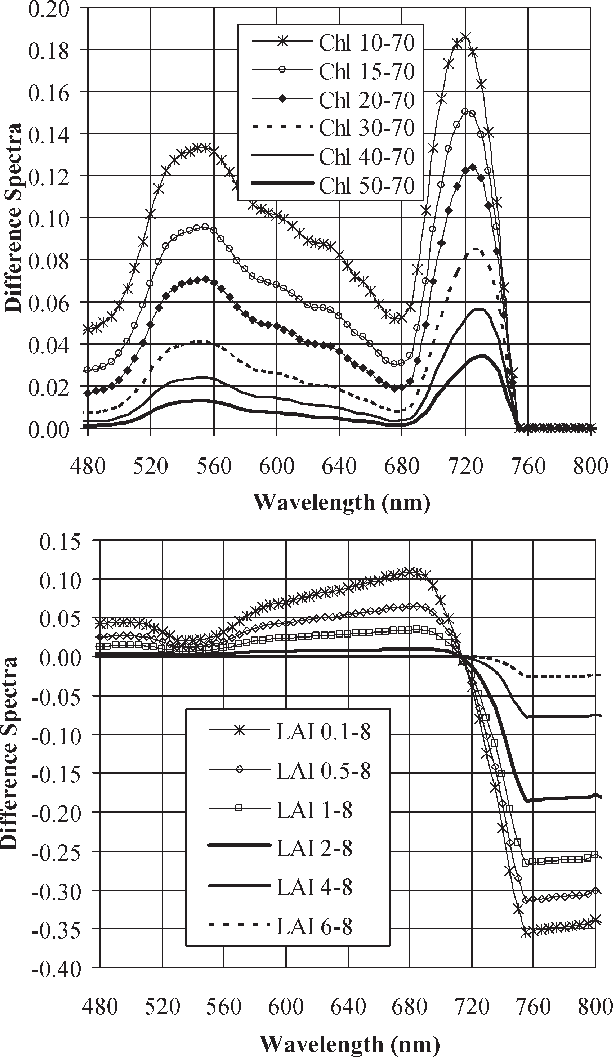
Figure 1: Leaf spectra can easily track varying levels of chlorophyll content and LAI,” Haboudone et al. 2008. (Image credits: IEEE Transactions on Geoscience and Remote Sensing 46(2):423 – 437 March 2008)
Crop emergence can be estimated by biomass, leaf area index, and chlorophyll estimation, and the latter two can be determined by leaf spectral data; see Figure 1. This is best done by applying precision farming methods, where remotely sensed imagery is analyzed by the following means:
- Quantifying chlorophyll content with leaf spectral data to determine the extent of crop emergence as chlorophyll content increases as the plant emerges and grows.
- The leaf area index (LAI), estimated by leaf spectral data, can also be used to determine plant vegetative structure and its changes. As the plant grows, the number of leaves increases, along with the crown. Therefore, it provides information on the growth stage of a crop and the population size. This also helps farmers to estimate the amount of harvest they can expect to get.
Both chlorophyll content and LAI are subsequently analyzed by vegetative indices to quantify leaf cover and plant growth, such as the Normalized Difference Vegetation Index (NDVI), Renormalized Difference Vegetation Index (RDVI), Modified Simple Ratio (MSR), and Soil Adjusted Vegetation Index (SAVI). The SAVI is important where grain crops are monitored in the earlier stages of growth and when soil background noise has to also be considered.
The analyzed map shows the farmer what percentage of their land has crops and how many plants they have. Based on this information, farmers can decide whether they need to replant and where to resow.
2. Crop Growth
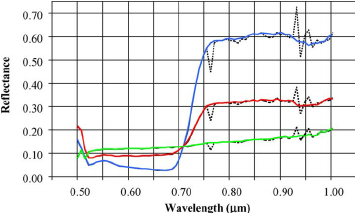
Figure 2: “Sample of hyperspectral leaf spectra (dotted lines) before and (solid lines) after flat-field correction for (green) asphalt, (red) corn from a plot with low-level nitrogen supply, and (blue) corn from a plot with high nitrogen supply,” Haboudone et al. 2008. (Image credits: IEEE Transactions on Geoscience and Remote Sensing 46(2):423 – 437 March 2008)
Crop growth rates depend on optimum environmental conditions, such as nutrients and water. So, once again, chlorophyll content and LAI can be used to check the growth rate of crops. Chlorophyll content estimation is a good measure of the soil nitrogen content and soil conditions.
The pigment levels are usually estimated by portable tools like the CI-710s SpectraVue Leaf Spectrometer at leaf scale, and hyperspectral imagery taken by remote sensing at large-scales.
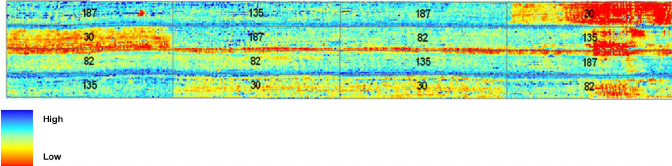
Figure 3: “Map of chlorophyll status showing the relationship between chlorophyll concentration and the ratio TCARI/OSAVI. Numbers 30, 82, 135, and 187 represent prior nitrogen fertilizer supply in kilograms per hectare resulting in chlorophyll difference. Chlorophyll content ranges from (red tones) 9 μ g/cm2 to (blue tones) 72 μ g/cm2,” Haboudone et al. 2008. (Image credits: IEEE Transactions on Geoscience and Remote Sensing 46(2):423 – 437 March 2008
Hyperspectral images have also been shown to successfully identify leaf nitrogen, phosphorus, and potassium content in trees, shrubs, and grasses. This ability can be used to identify soil nutrient deficiencies in croplands, pastures, and forests.
Based on maps, as shown in Figure 3, a farmer can see which parts of the farm or pastures have responded well to nitrogen fertilizers applied (blue) and where levels of chlorophyll are less (red), i.e. the crop growth rate has been less. Using the map, the farmer can decide where to add more nutrients. In some cases, a lack of growth in places with high fertilization indicates some other problems.
3.Crop Stress
Whether the cause is drought, pests, or disease, noticeable changes will occur in chemical and pigment concentrations, leaf area, and structure due to stress. Changes in chlorophyll level and fluorescence are used to detect all of these stresses. These can be estimated by remotely sensed imagery, by field measurements with leaf spectrometers like CI-710 or by the Handheld Photosynthesis System CI-340.
Once the level of stress is determined, the farmers can calculate the rate and location of treatment. Commercial precision and smart farming service providers produce maps showing zones with two to three intensities of stress, so that variable rate application is possible only in zones with an infestation/problem.
Heavy metal stress: Stress caused by copper (Cu), zinc (Zn), lead (Pb), chromium (Cr), and cadmium (Cd) can be detected by remotely sensed hyperspectral images by examining changes in the visible and red edge light ranges. This can be important, for example, in grape vineyards.
Weed stress through competition: Though annual crops and weeds are both green, leaf spectral data don’t measure just chlorophyll content. Leaf structure differences in thickness, mesophyll, and cuticle produce distinct leaf spectral signatures for each crop, thus helping to differentiate crops from weeds. For example, some grasses produce high blue reflectance.
Pest stress: Chlorophyll content and chlorophyll fluorescence can be used to estimate the damage to crops by pests. Fluorescence can detect changes much earlier than the appearance of visual symptoms that can be seen by people or recorded by RGB or even NIR reflectance. At higher intensities of stress, leaf reflectance of NIR can also measure changes in chlorophyll.
Disease Stress: Diseases trigger the release of chemicals and also result in structural modification in leaves. Salicylic acid, flavonoids, coumarins, and phenolics can be released, which influence fluorescence. Wall lignification due to disease response results in yellow fluorescence. Even early symptoms of viruses can be detected by fluorescence.
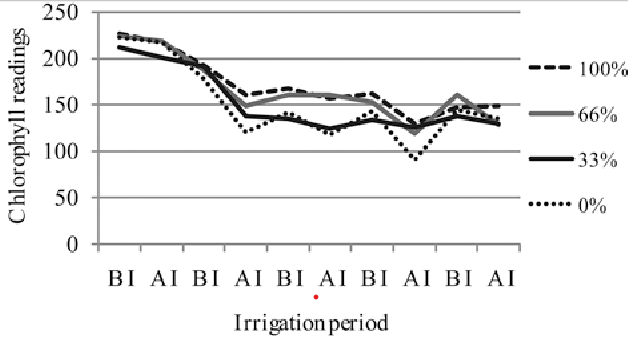
Figure 4: Chlorophyll levels fall due to water stress, but are higher after an irrigation (AI) than before irrigation (BI) for all levels of stress, Genc et al 2013. (Image credits: Zemdirbyste-Agriculture, vol. 100, No. 1 (2013),DOI 10.13080/z-a.2013.100.011)
Drought stress: Plants are made up of a large percentage of water: up to 98% relative water content (RWC) in turgid leaves and 30-40% in desiccated and dying leaves. Crops start wilting when the RWC is 60-70%. Since water has a strong spectral signature, it is easy to find water content in crops and detect if they suffer drought stress.
Water stress in leaves can also be detected through an increase in chlorophyll fluorescence and a decrease in chlorophyll content.
As water stress increases there is less reflectance in the visible and more in the NIR range due to less chlorophyll and changes in leaf morphology; see Figure 4.
Chlorophyll fluorescence is better at early detection of drought. In soybean plants, the reflectance of less drought-stressed plants remained unchanged, but red and blue fluorescence were greater than normal.
Application of Leaf Spectral Data in Forestry
In Forestry, leaf spectral signatures help managers in tackling challenges with the following:
- Species identification
- Stress detection
Species identification is usually attempted by using large-scale imagery to identify communities of vegetation. Stress can be identified by both large-scale and leaf-scale investigations. Once again, leaf spectrometers like the CI-710 SpectraVue Leaf Spectrometer or the CI-340 Handheld Photosynthesis System are used.
Species Identification
Differences in whole tree crown readings are used to identify species in forests. Here, the leaf structure-like differences in leaf thickness, mesophyll, and cuticle thickness produce a difference in leaf spectral data, helping in their identification.
Reflectance spectral readings of the whole tree crown will be different than the measurement of a single leaf due to differences in abaxial and adaxial reflectance, as the crown will have leaves positioned at various angles due to the branching pattern. The characteristic architectures of trees help to enhance the difference in their reflectance, as shown in Figure 5. However, other factors, such as leaf age and stress, can also influence spectral data and should be considered.
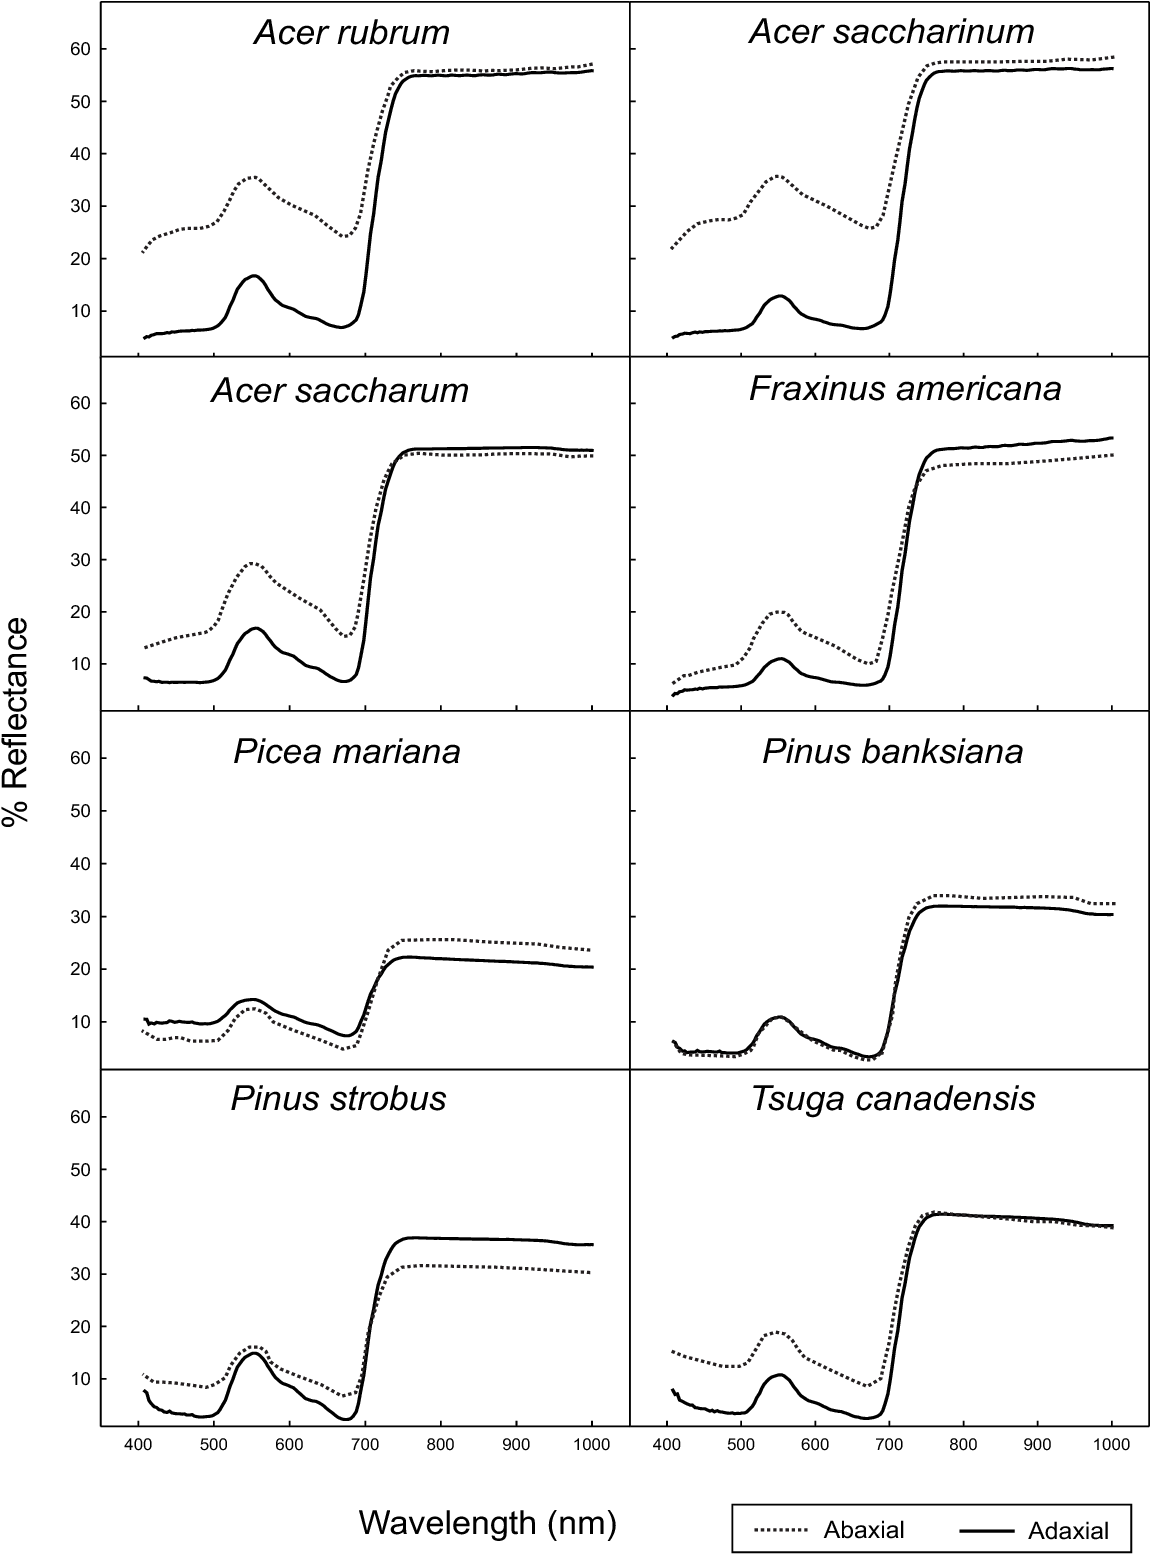
Figure 5: “Abaxial and adaxial leaf reflectance,” Mohammed et al 2000. (Image credits: https://www.semanticscholar.org/paper/Natural-and-stress-induced-effects-on-leaf-spectral-Mohammed-Noland/)
Stress detection
Reflectance cannot always identify the cause of stress—such as drought, pest, or diseases—as many of them could be occurring simultaneously, and they produce similar spectral results. However, there are several changes in leaf spectral information that are used to detect stress.
- Pest Stress: The “red edge,” or the rise in reflectance, at the red light wavelength is consistent for each tree species and usually lies between 680 to 750 nm. Stress causes a shift of the red edge towards shorter wavelengths (blue) to produce the “red edge-blue shift.” This has been shown in Acer saccharum leaves suffering from pest attacks. Pest stress also changes red to more green and yellow reflectance as in Abies and Picea attacked by spruce budworm.
- Drought Stress: Measurement of chlorophyll fluorescence is more sensitive to lower intensities of drought. Higher intensities can be detected by a shift in leaf reflectance in the infrared regions from 1300 to 2500 nm.
Applications of Leaf Sectral Information in Research
Based on the ability of leaf spectral information to detect growth, health, and stress that plants and trees undergo, scientists have used these techniques to research several themes:
- Biogeochemical nutrient cycling can be tracked by studying leaf N, P, and K status of natural pristine and degraded ecosystems to help in their conservation and restoration, respectively.
- Study the distribution of plant and leaf traits as a response to climate and elevation, as leaf spectral data gives an insight into the chemical and structural traits of leaves, branching, photosynthetic capacity, and plant nutrition.
- Monitor heavy metal pollution in phytoremediation through annual and perennial crops, as some heavy metals change the leaf structure at the cellular level, thereby altering spectral information.
- Plant response and mechanisms to cope with drought and higher temperatures by studying changes in leaf cuticle wax thickness and changes in photosynthesis.
Leaf Spectral Information is Versatile
The uses of leaf spectral data listed above are far from comprehensive, but the above should give an idea of the range of areas and sectors where it has an application. There are many commercial portable devices and software for precision and smart farming that utilize leaf spectral information to provide user-friendly experiences for farmers, foresters, and researchers alike. They make food, fiber, and timber production more sustainable by cutting the amount of inputs, energy, and labor, while at the same time increasing profits. Moreover, environmental conservation, research, and industry are greatly aided by the widespread availability of versatile leaf spectral information.
—
—
Vijayalaxmi Kinhal
Science Writer, CID Bio-Science
Ph.D. Ecology and Environmental Science, B.Sc Agriculture
Feature image courtesy of Hannes Flo
Sources
Abbasi, M., Darvishsefat, A. A., Schaepman, M. E. (2010). Comparison of adaxial and abaxial spectral reflectance of Fagus orientalis Lipsky and Carpinus betulu using field spectroradiometer and spectral indices. Iranian Journal of Forest, 2(3):253-261.
Doughty, C. E., Santos-Andrade, P. E., Goldsmith, G. R., Blonder, B., Shenkin, A., Bentley, L. P., . . . Malhi, Y. (2017). Can Leaf Spectroscopy Predict Leaf and Forest Traits Along a Peruvian Tropical Forest Elevation Gradient? Journal of Geophysical Research: Biogeosciences, 122(11), 2952-2965. doi:10.1002/2017jg003883
Ge, Y., Atefi, A., Zhang, H. et al. (2019). High-throughput analysis of leaf physiological and chemical traits with VIS–NIR–SWIR spectroscopy: a case study with a maize diversity panel. Plant Methods 15, 66. https://doi.org/10.1186/s13007-019-0450-8
Genc, L., Inalpulat, M., Kizil, U., Mirik, M., Smith, S. E., & Mendes, M. (2013). Determination of water stress with spectral reflectance on sweet corn (Zea mays L.) using classification tree (CT) analysis. Zemdirbyste-Agriculture, 100(1), 81-90. doi:10.13080/z-a.2013.100.011
Haboudane, D., Tremblay, N., Miller, J. R., & Vigneault, P. (2008). Remote Estimation of Crop Chlorophyll Content Using Spectral Indices Derived From Hyperspectral Data. IEEE Transactions on Geoscience and Remote Sensing, 46(2), 423-437. doi:10.1109/tgrs.2007.904836
He, Zhang, Su, Lu, Yao, Cheng, . . . Tian. (2019). Estimating Leaf Area Index with a New Vegetation Index Considering the Influence of Rice Panicles. Remote Sensing, 11(15), 1809. doi:10.3390/rs11151809
Leaf Relative Water Content (RWC). (n.d.). Retrieved August 06, 2020, from https://plantstress.com/leaf-relative-water-content-rwc/
Lenk, S., Chaerle, L., Pfundel, E. E., Langsdorf, G., Hagenbeek, D., Lichtenthaler, H. K., . . . Buschmann, C. (2006). Multispectral fluorescence and reflectance imaging at the leaf level and its possible applications. Journal of Experimental Botany, 58(4), 807-814. doi:10.1093/jxb/erl207
Lu, F., Bu, Z., & Lu, S. (2019). Estimating Chlorophyll Content of Leafy Green Vegetables from Adaxial and Abaxial Reflectance. Sensors (Basel, Switzerland), 19(19), 4059. https://doi.org/10.3390/s19194059
Mohammed, G.H., Noland, T.L., Irving, P., Sampson, P.H., Zarco-Tejada, P.J., & Miller, J.R. (2000). Natural and stress-induced effects on leaf spectral reflectance in Ontario species. Retrieved from https://www.semanticscholar.org/paper/Natural-and-stress-induced-effects-on-leaf-spectral-Mohammed-Noland
Peng, Y., Zhang, M., Xu, Z. et al. (2020). Estimation of leaf nutrition status in degraded vegetation based on field survey and hyperspectral data. Sci Rep 10, 4361. https://doi.org/10.1038/s41598-020-61294-7
Sridhar, B. B., Han, F. X., Diehl, S. V., Monts, D. L., & Su, Y. (2007). Spectral reflectance and leaf internal structure changes of barley plants due to phytoextraction of zinc and cadmium. International Journal of Remote Sensing, 28(5), 1041-1054. doi:10.1080/01431160500075832
Stroppiana, D., Villa, P., Sona, G., Ronchetti, G., Candiani, G., Pepe, M., . . . Boschetti, M. (2018). Early season weed mapping in rice crops using multi-spectral UAV data. International Journal of Remote Sensing, 39(15-16), 5432-5452. doi:10.1080/01431161.2018.1441569
Most Popular Articles
- Transpiration in Plants: Its Importance and Applications
- Leaf Area – How & Why Measuring Leaf Area…
- How to Analyze Photosynthesis in Plants: Methods and Tools
- Forest & Plant Canopy Analysis – Tools…
- The Forest Canopy: Structure, Roles & Measurement
- The Importance of Leaf Area Index (LAI) in…
- Root Respiration: Importance and Applications
- Stomatal Conductance: Functions, Measurement, and…
- Irrigating with Saline or Seawater
- Crop Water Use Efficiency Explained


